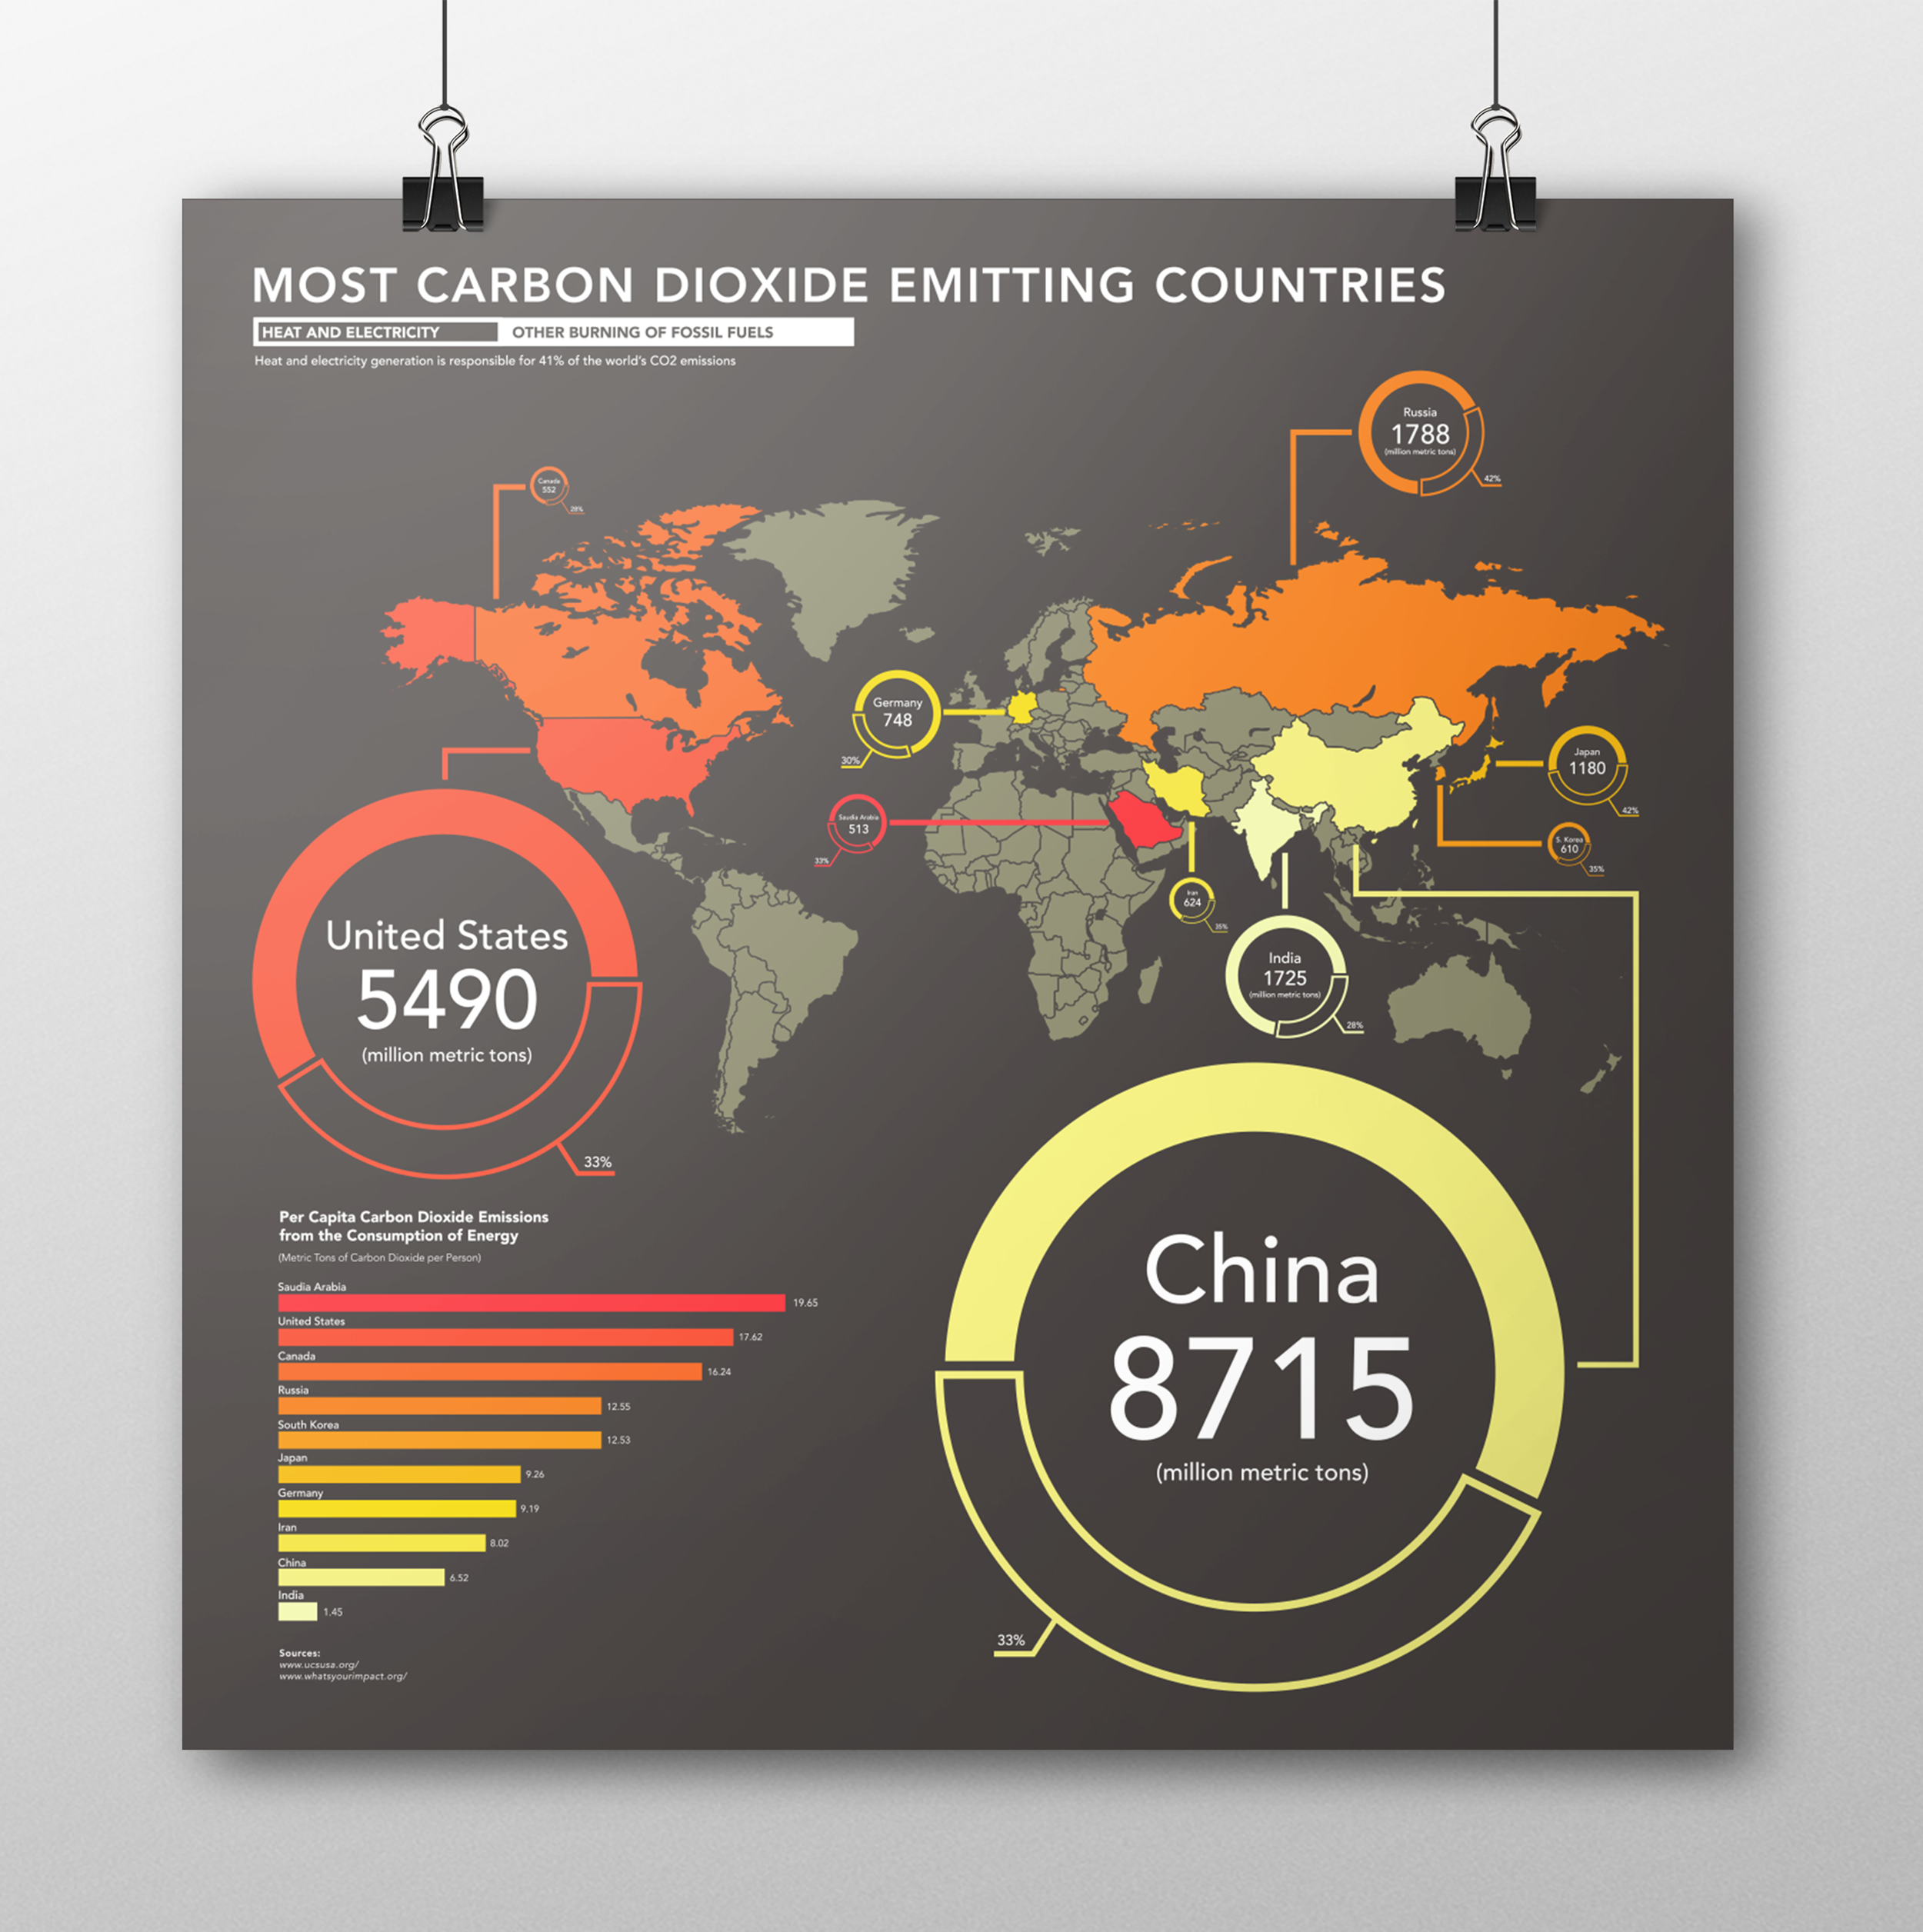
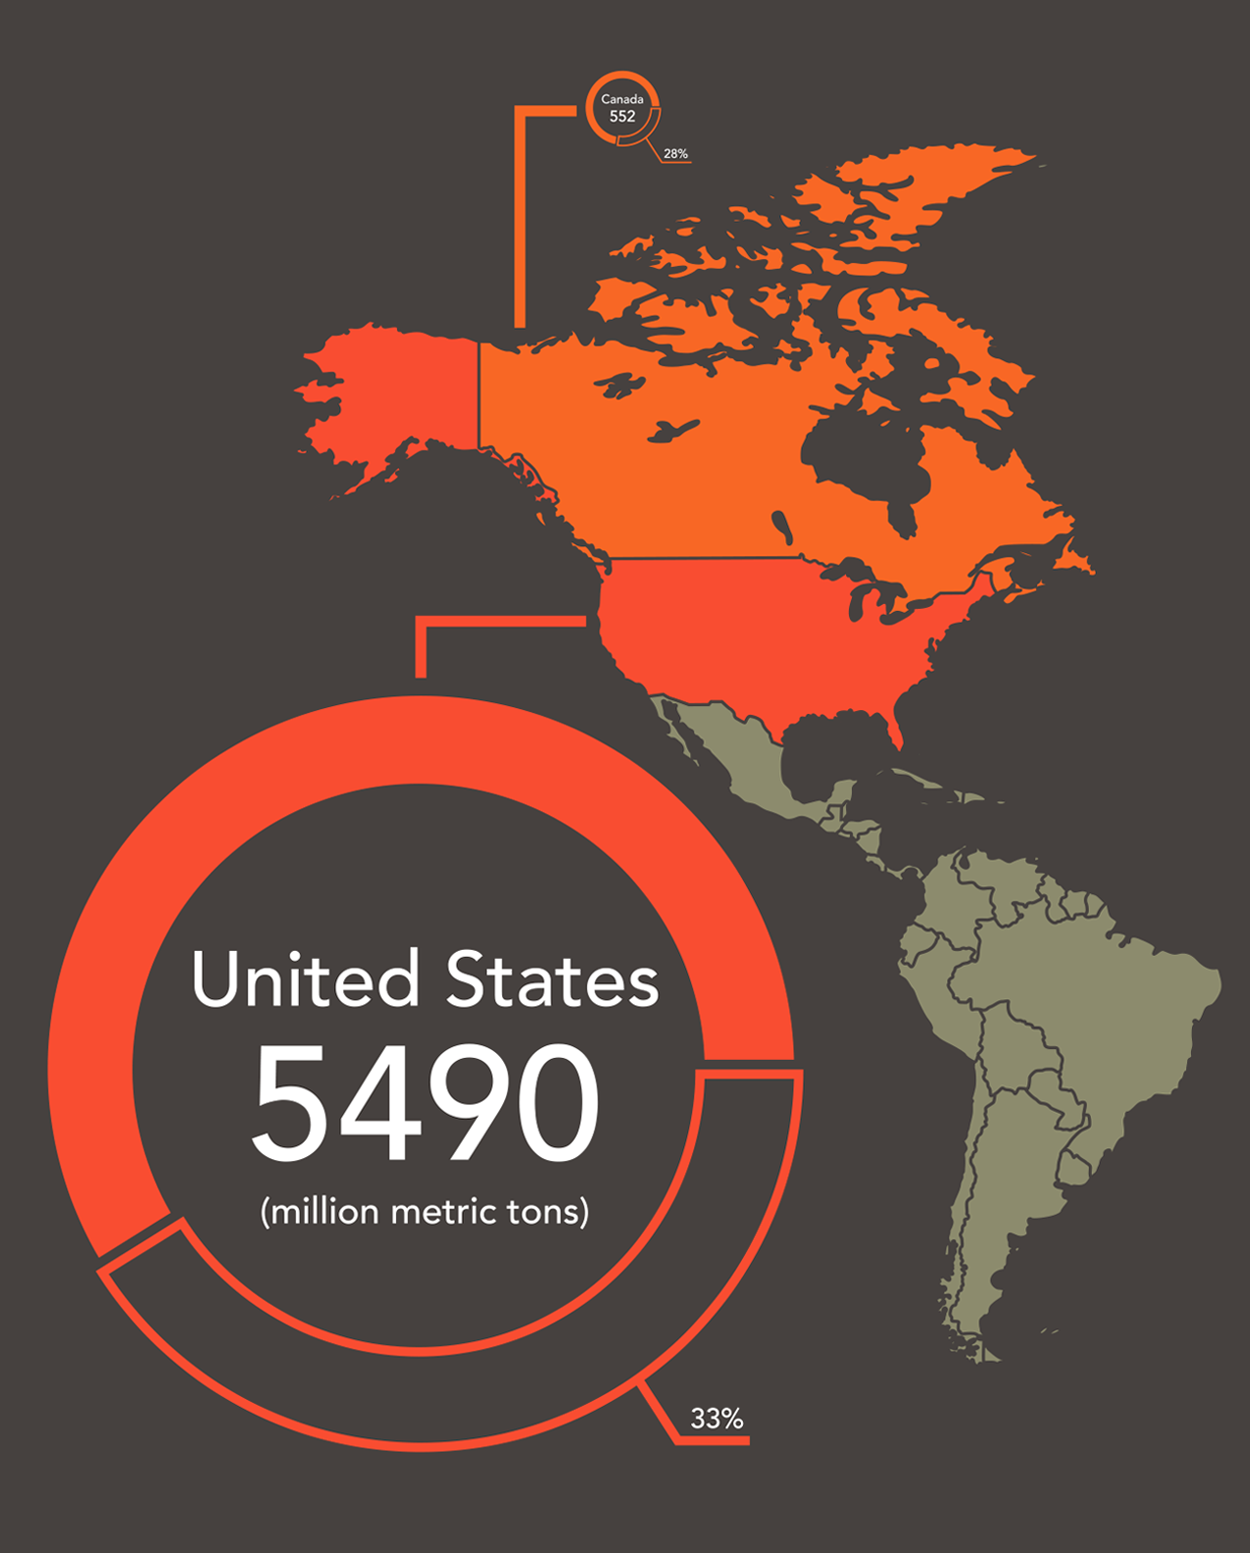
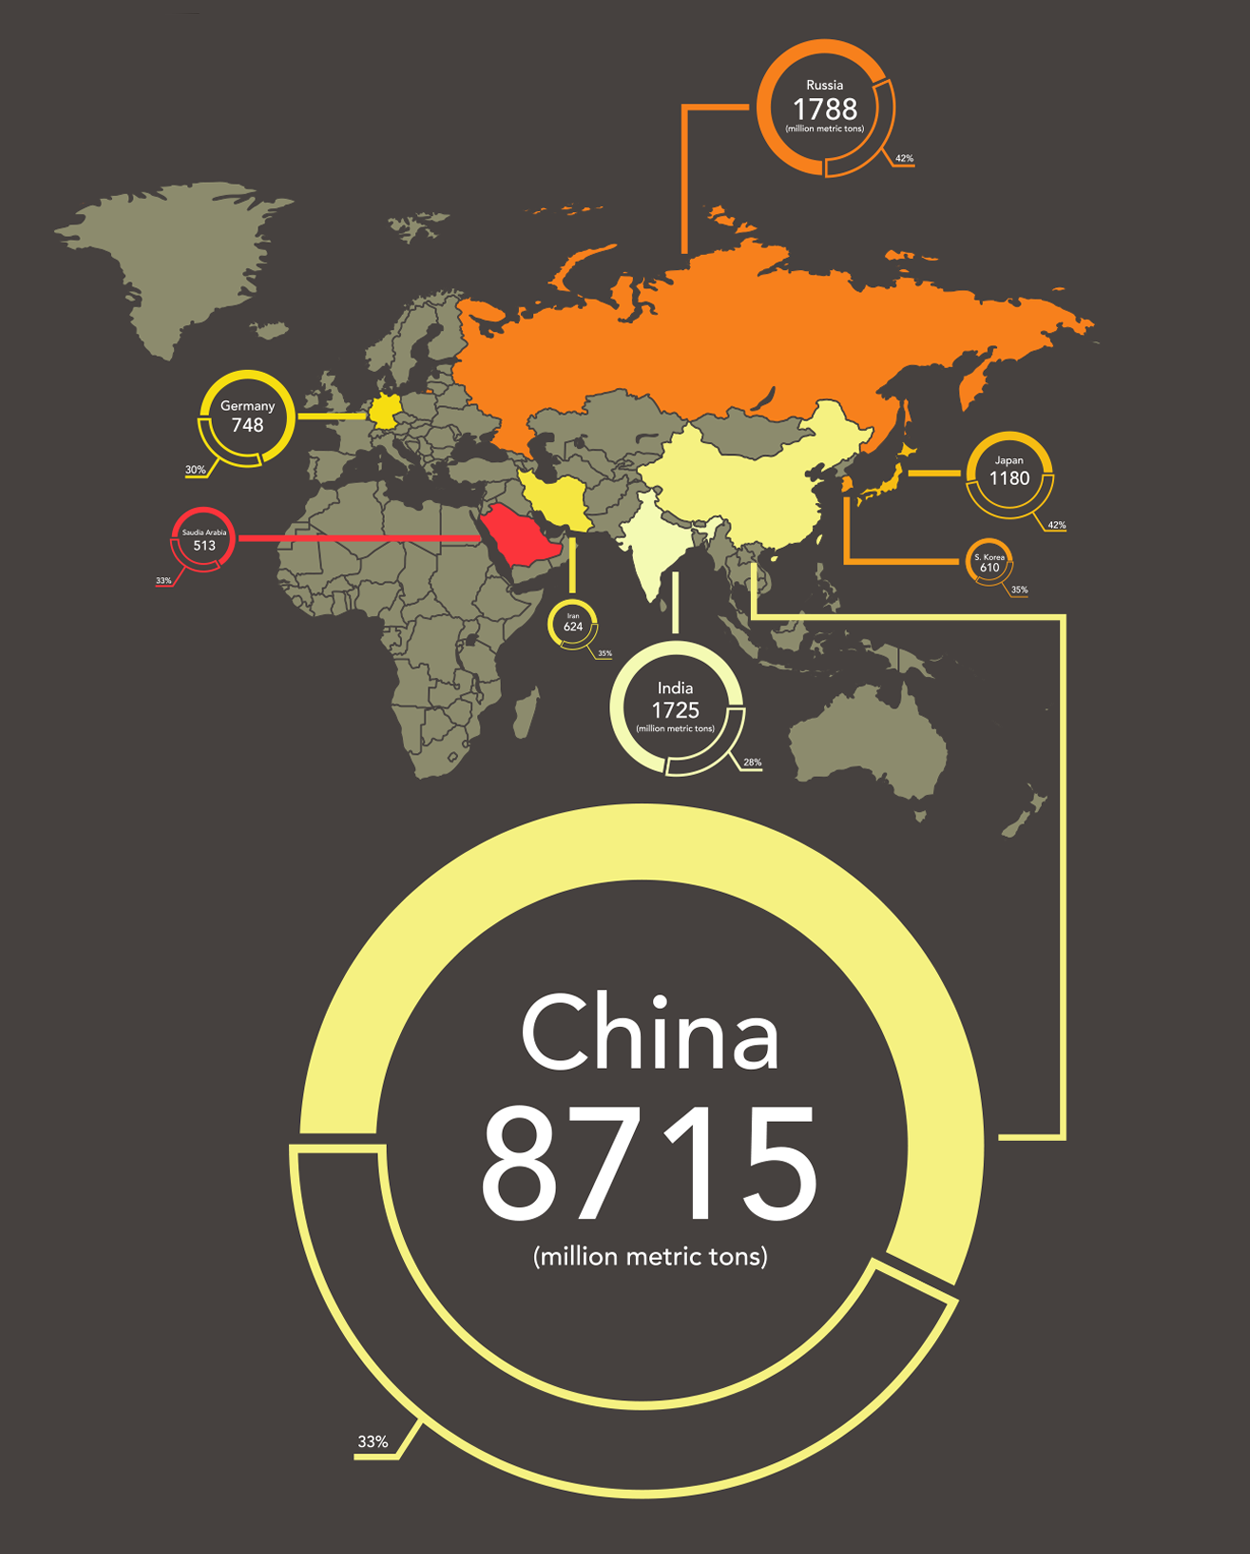
Most Carbon Dioxide Emitting Countries
During my senior year of schooling I was challenged with creating an infographic that combined several layers of information into one image. A 2016 report published by the Union of Concerned Scientists explored country’s CO2 emissions from heat and electricity generation while comparing rates of emission based on population density. Utilizing the information found in the report, I created an info-graphic to reveal the world’s top 10 contributors of CO2 emissions per capita. The final design illustrates each countries metric tons of emissions, percentage due to heat and electricity generation, and emissions contributed per person.
Year: 2018
Client: Class Project
Role: Designer